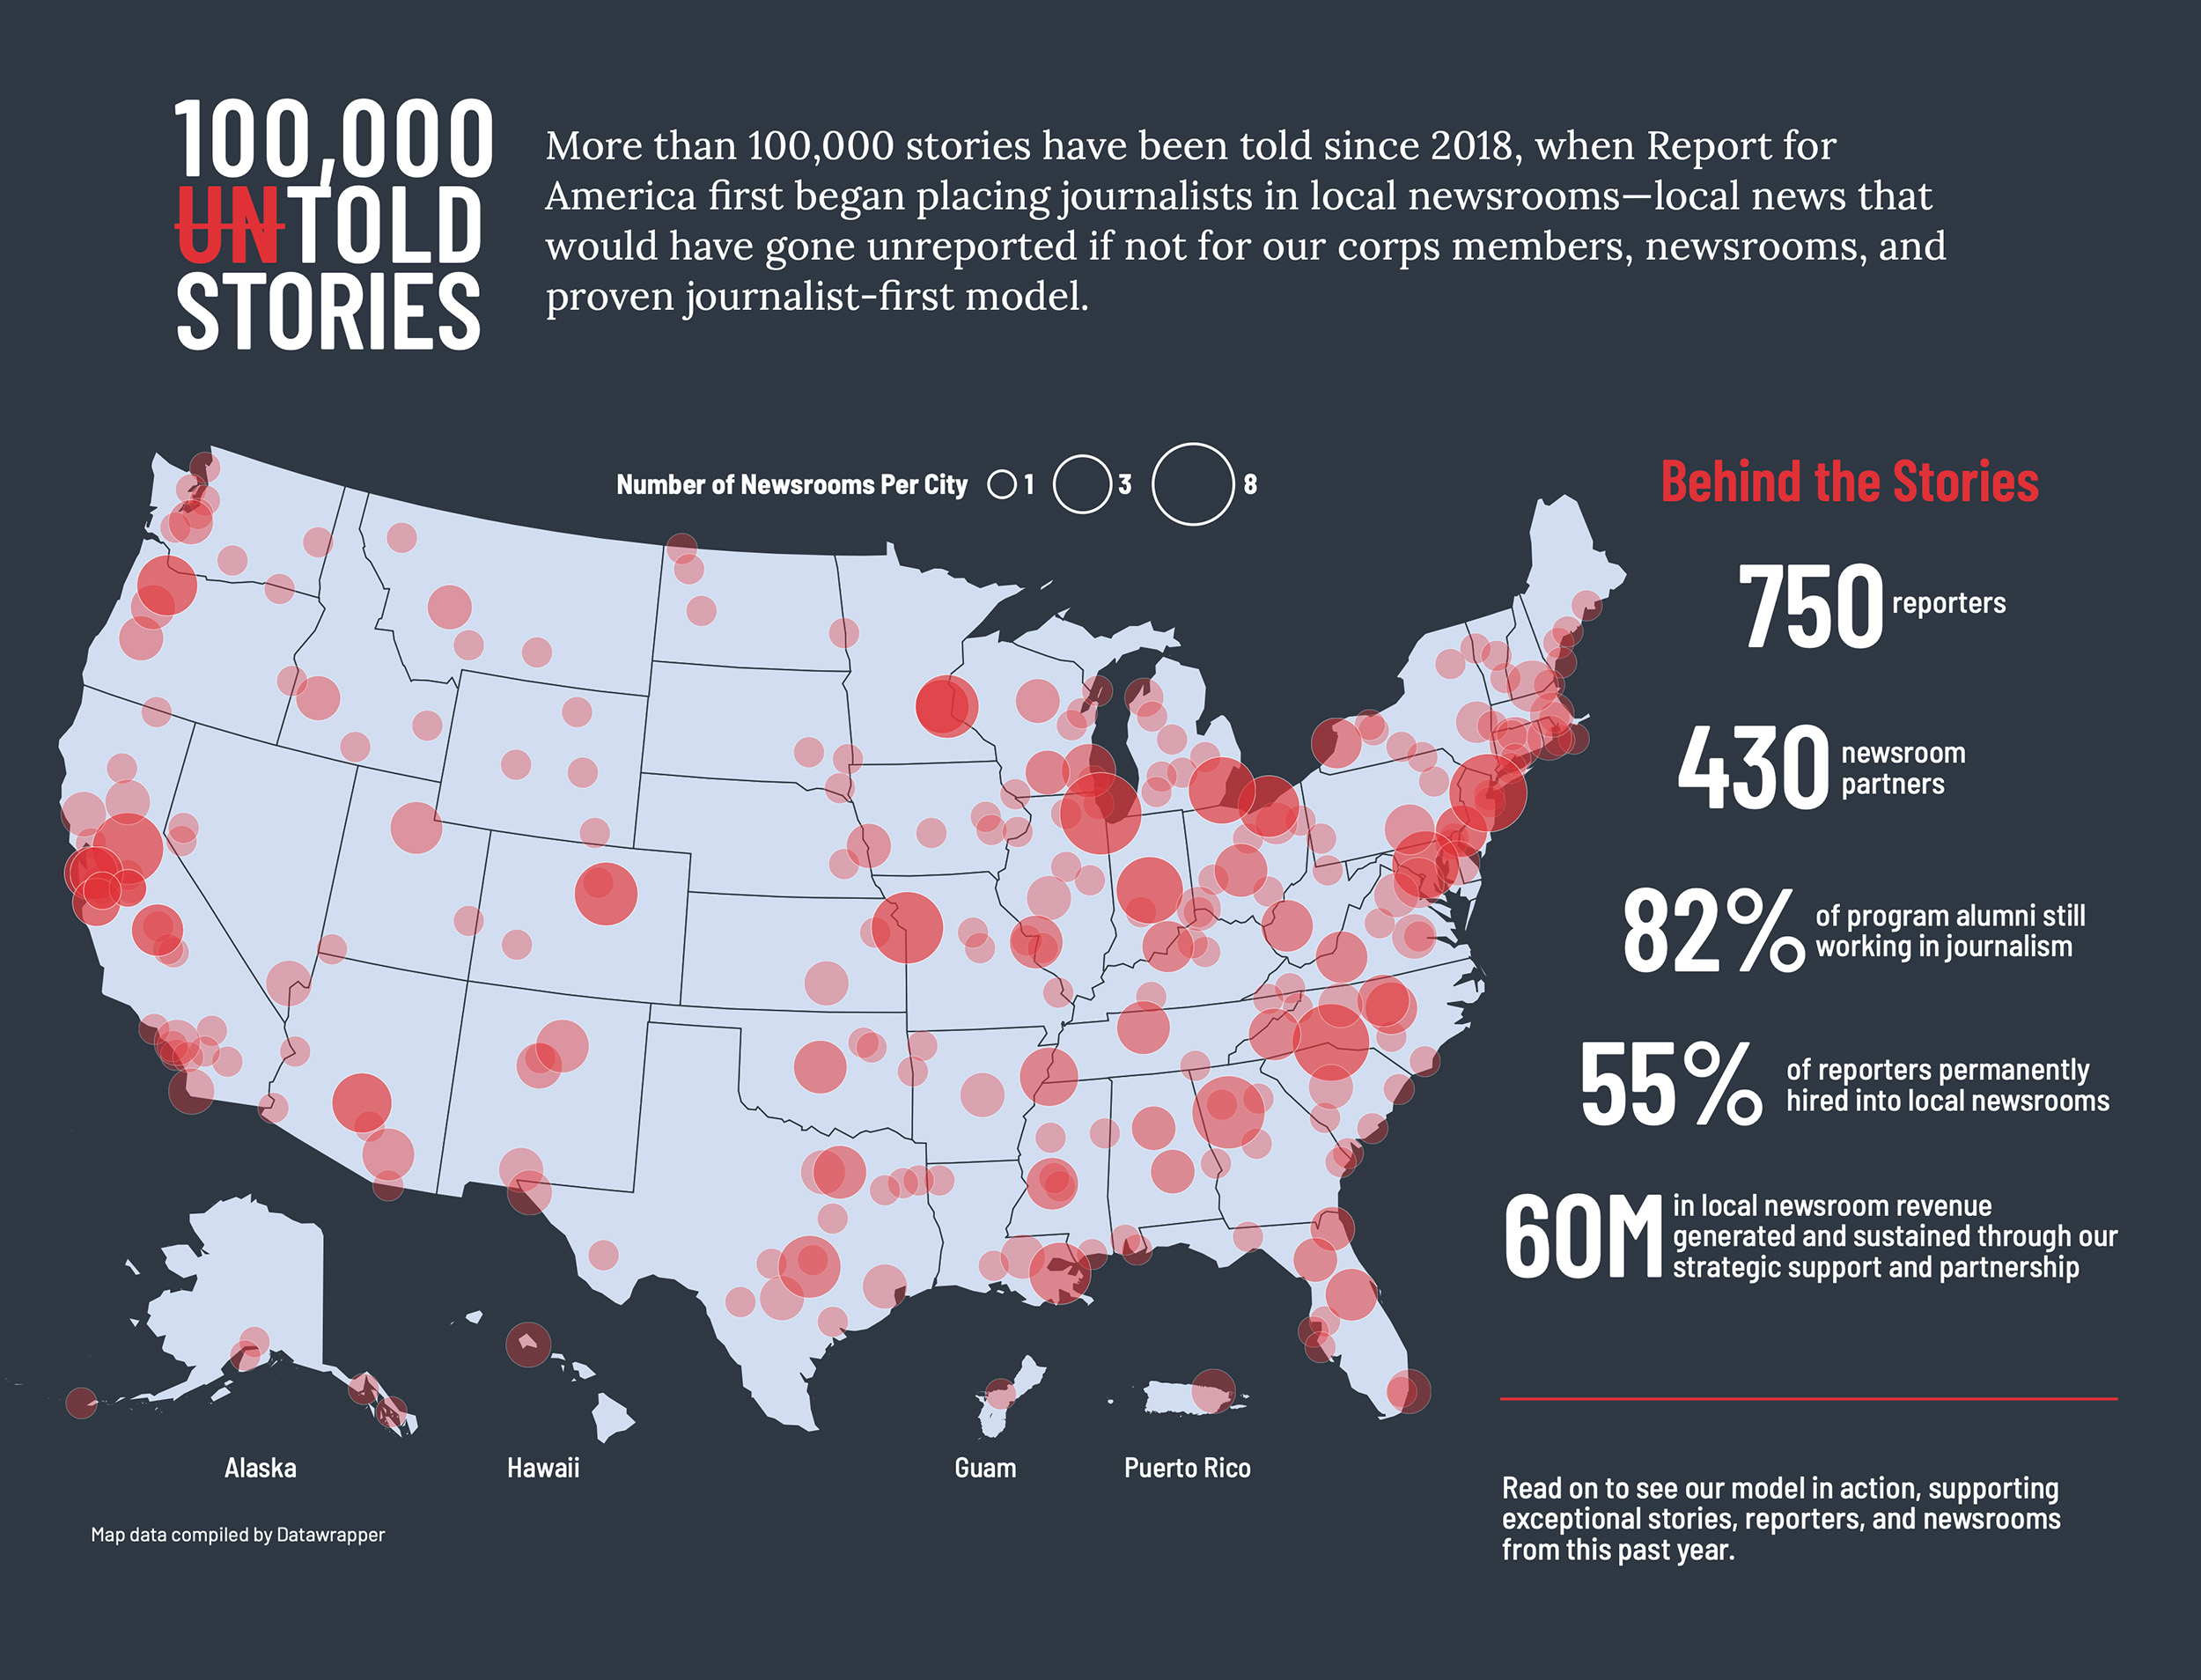
This complex data visualization tells the story of the impact Report For America has had on local newsrooms around the nation. The dataset included hundreds of newsrooms across the country, all of which were compiled using Datawrapper to compose the visualization.
Infographics
All images and text Copyright © 2026 Sean Noyce


